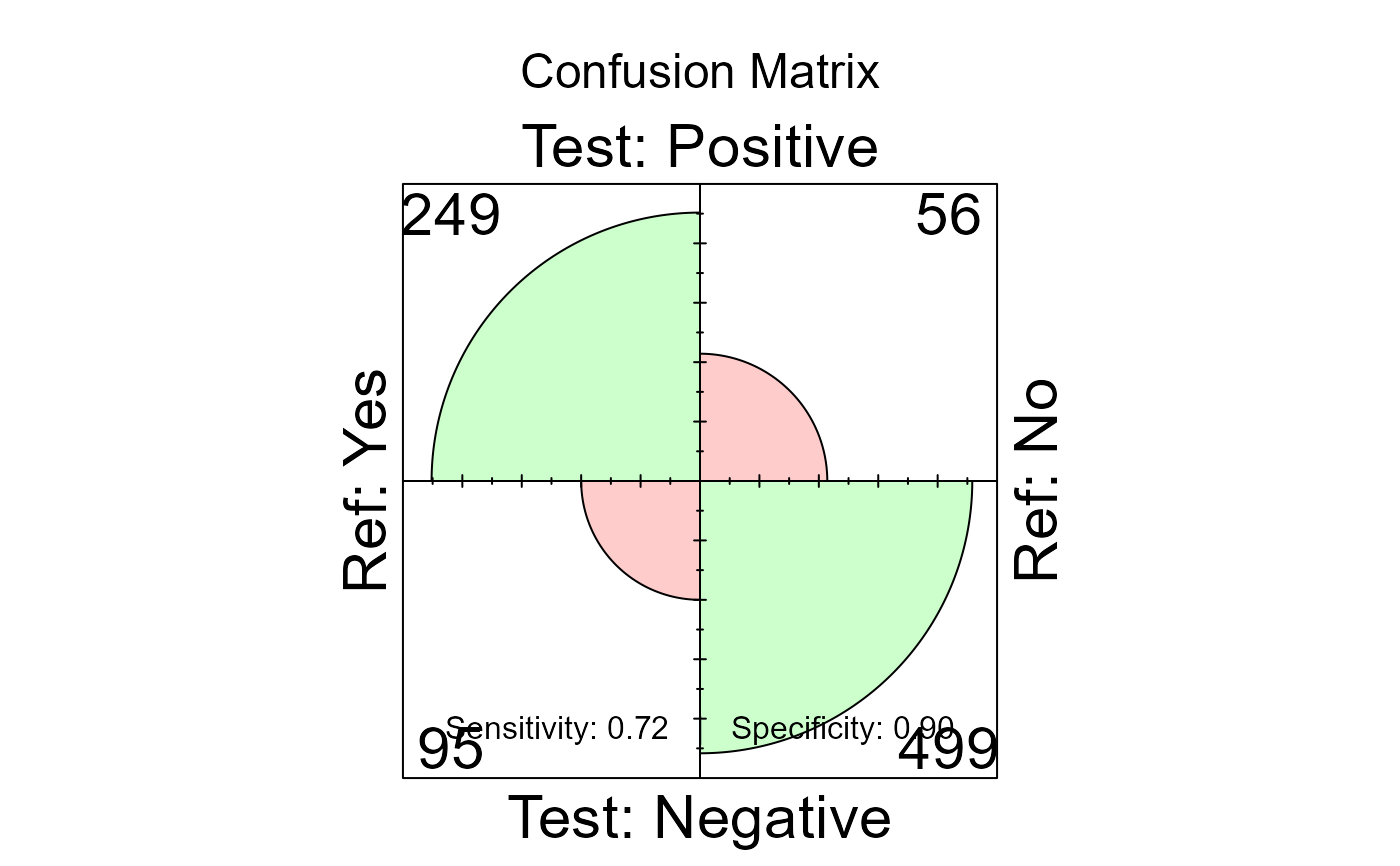
Draws a fourfold display of the retained confusion matrix with sensitivity and specificity annotated on the bottom margin.
Arguments
- x
A
simtab_diagresult.- col
Character vector of length 2. Fill colours for the negative and positive quadrants respectively. Default:
c("#ffcccc", "#ccffcc").- main
Character. Plot title. Default:
"Confusion Matrix".- ...
Additional arguments passed to
graphics::fourfoldplot().